Salesforce Reports & Dashboards: Visualize What Matters

This hub gives you real-world tutorials and templates to build powerful Salesforce reports and dashboards, with less confusion and more clarity.
Section 1

Start Here – Reporting Foundations

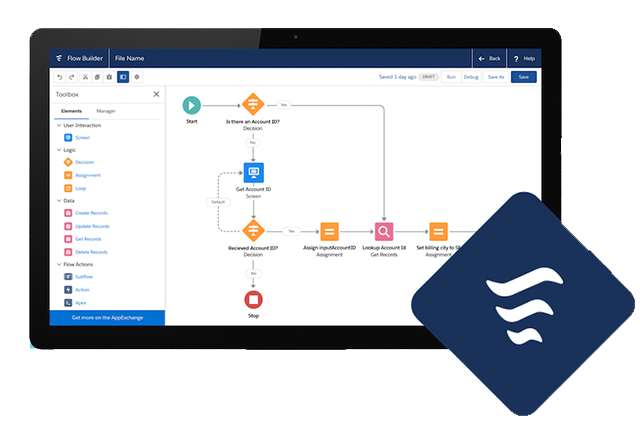
What Salesforce Flows Are (And Why Admins Should Master Them)

Great reporting starts with clean data and clear intent. Whether you’re new to Salesforce reporting or rebuilding your dashboards, these guides cover the core concepts every admin and ops lead should master.

🔹 Salesforce Reports Every Admin Should Build
→ From opportunity tracking to service performance.

🔹 Create Actionable Dashboards in Salesforce
→ Layouts that drive decisions, not just graphs.

🔹 Salesforce Report on Reports
→ Meta-reporting: track what’s actually being used.

Section 2

Advanced Reporting Features

Joined Reports & Formatting Tips

Salesforce has powerful reporting tools — if you know how to use them. These tutorials walk you through joined reports, cross filters, custom summary formulas, and chart formatting.


🔹 Salesforce Joined Reports – Explained
→ Compare objects in a single report.

🔹 Formatting Tips for Better Dashboards
→ Grouping, summary fields, chart choices, and conditional highlights.

🔹 Scheduling & Emailing Dashboards
→ Automate dashboard delivery to stakeholders. (If no article exists yet, mark as “Coming Soon”)

Section 3

Clean Data = Better Reports

Clean Up Your Data for Better Reporting

Even the best dashboard can’t fix dirty data. These guides help you optimize your records and system setup so your reports actually reflect reality.

🔹 Clean Up Your Salesforce Org
→ Merge fields, remove redundancies, and standardize naming.

🔹 Audit Flow Impact on Reporting
→ Ensure flows aren’t skewing your results.

🔹 Archive Inactive Fields to Simplify Filters
→ Reduce clutter and improve performance.

Section 4

Dashboards That Drive Decisions

Real Use Cases & Examples

Skip the fluff. These dashboard examples are designed to track what actually matters: pipeline progress, service KPIs, task performance, and user adoption.

Need Help Designing Your Dashboards?

Book a Free Reporting Strategy Call

Want help building reports your team actually uses? Let’s streamline your dashboards and tell the right story with your CRM data.